


Automatic pollen monitors
Because every grain of pollen counts...
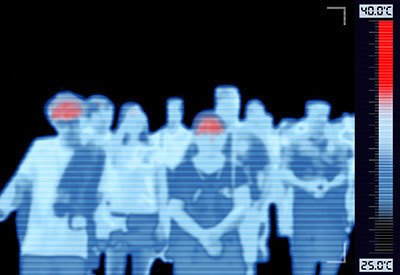
Ambrosia, birch, alder, hazel: About 30% of the population are to a lesser or greater degree affected by the pollen of these and other plants, trees, and bushes. The symptoms can range from relatively mild rhinitis (hay fever) through to anaphylactic shock, which may be life-threatening. Knowing the pollen count on any given day at a specific location is thus very important for the people affected. The FAULHABER drives used in the fully automatic pollen monitors from Helmut Hund GmbH and installed at various locations ensure that the pollen meters provide reliable and, above all, timely data for pollen forecasting.
Studies predict that up to 50% of the population will be affected by pollen in the future. In addition, global warming and climate change are altering the flowering season and thus the periods of high pollen counts. "In milder winters, our monitoring showed hazel pollen already at the end of November. Normally, this pollen is expected in January," reports Dr. Jörg Haus, Product Management Instruments, Helmut Hund GmbH. Particularly ambrosia, which blooms from July to October, is a big problem for allergy sufferers. Its allergy potential is five times that of grass. "As few as 11 grains of pollen in one cubic meter of air are considered a heavy load." This can result in rhinitis, sensitivity to light, headaches, shortness of breath, or severe asthma. Imported plants can also turn into an unexpected problem, explains Dr. Haus: "Olive trees, which many people enjoy having on their balconies or terraces, ence book for identification, trained pollen counters announce the result in around 2 to 3 days – sometimes, however, this can take up to several weeks. And because pollen change depending on the season and climate, errors can occur during analysis which lead to misclassification rates in the low double-digit percentage range. Nevertheless, this method remains the gold standard for counting pollen. The good thing is that relatively precise data is obtained in terms of pollen load and time on any given day. This data is then used to generate models for a region in a certain month or season. "Due to the way the system works, the data is at least two days old by the time it's available. This isn't much use to an allergy sufferer. If I'm planning an outdoor activity today because the sun's out or if I need to know whether or not to bring my asthma spray, 2-day old data from a day on which it may are very allergenic and are known to be the worst offenders in southern countries."
Delayed evaluation
This makes it all the more important to know when and which pollen are in the air and in what concentration. The standard used in many European countries is the so-called Burkhard trap. A defined volume of air is constantly drawn in by a fan from the current wind direction and guided past a slowly rotating drum. Affixed to this drum is an adhesive strip which the pollen and any other particles drawn into the drum stick to. The 14.4 m³ of air drawn in over the course of a day corresponds to what an adult at rest would breathe in. The adhesive strip must be replaced and analyzed after seven days at the latest. Then, with the aid of microscopes and a reference book for identification, trained pollen counters announce the result in around 2 to 3 days – sometimes, however, this can take up to several weeks. And because pollen change depending on the season and climate, errors can occur during analysis which lead to misclassification rates in the low double-digit percentage range. Nevertheless, this method remains the gold standard for counting pollen.
The good thing is that relatively precise data is obtained in terms of pollen load and time on any given day. This data is then used to generate models for a region in a certain month or season. "Due to the way the system works, the data is at least two days old by the time it's available. This isn't much use to an allergy sufferer. If I'm planning an outdoor activity today because the sun's out or if I need to know whether or not to bring my asthma spray, 2-day old data from a day on which it may have rained doesn’t help," says Dr. Haus, summarizing the problem with the most commonly used methodology. "So we started to figure out how to make the process more intelligent."

At the heart of the pollen monitor is the evaluation and analysis module
Real-time pollen monitoring
In 2003, a prototype automated pollen analysis was developed in a collaboration between the University of Freiburg and the local Frauenhofer Institute. It was evident early on that this solution required electric drives, e.g. for transporting the sample carriers, focusing the camera, or for scanning. "The design of the prototype wasn't ideal and couldn't be commercialized. So we at Helmut Hund GmbH, in collaboration with a new partner, decided to turn this into a product ourselves."
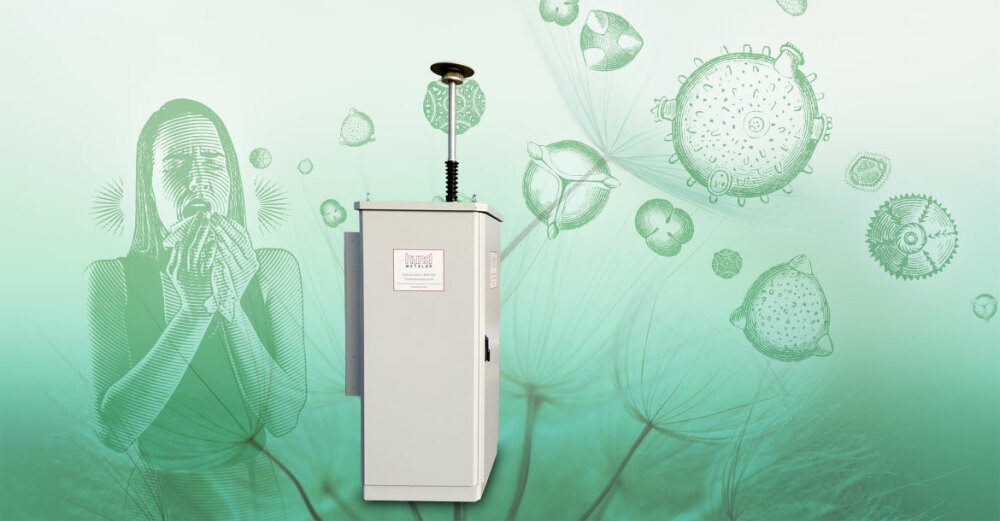
The new partner for the Wetzlar-based company was the Fraunhofer Institute for Applied Information Technology FIT in Sankt Augustin. The solution, the BAA500 pollen monitor, was developed in a joint effort. "BAA stands for bio-aerosol analyzer and combines our expertise in precision engineering, optics, and electronics," explains Dr. Haus. The device is air-conditioned and protected against weather, it can take between four to eight samples a day, with each sampling operation taking about three hours, and it works autonomously for up to six months. "The BAA500 enables us to provide a near real-time forecast as to which pollen are in the air and in what concentration."
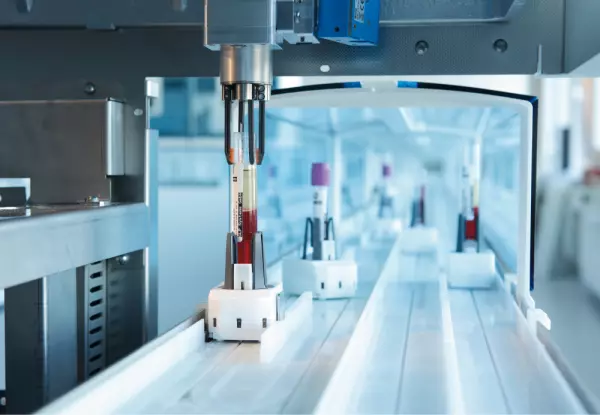
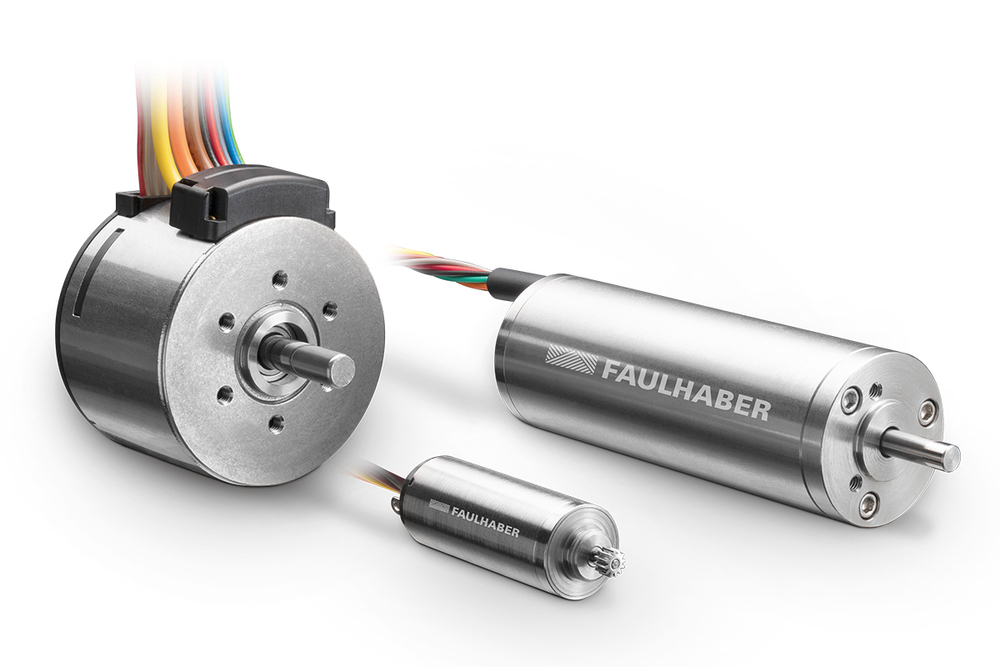
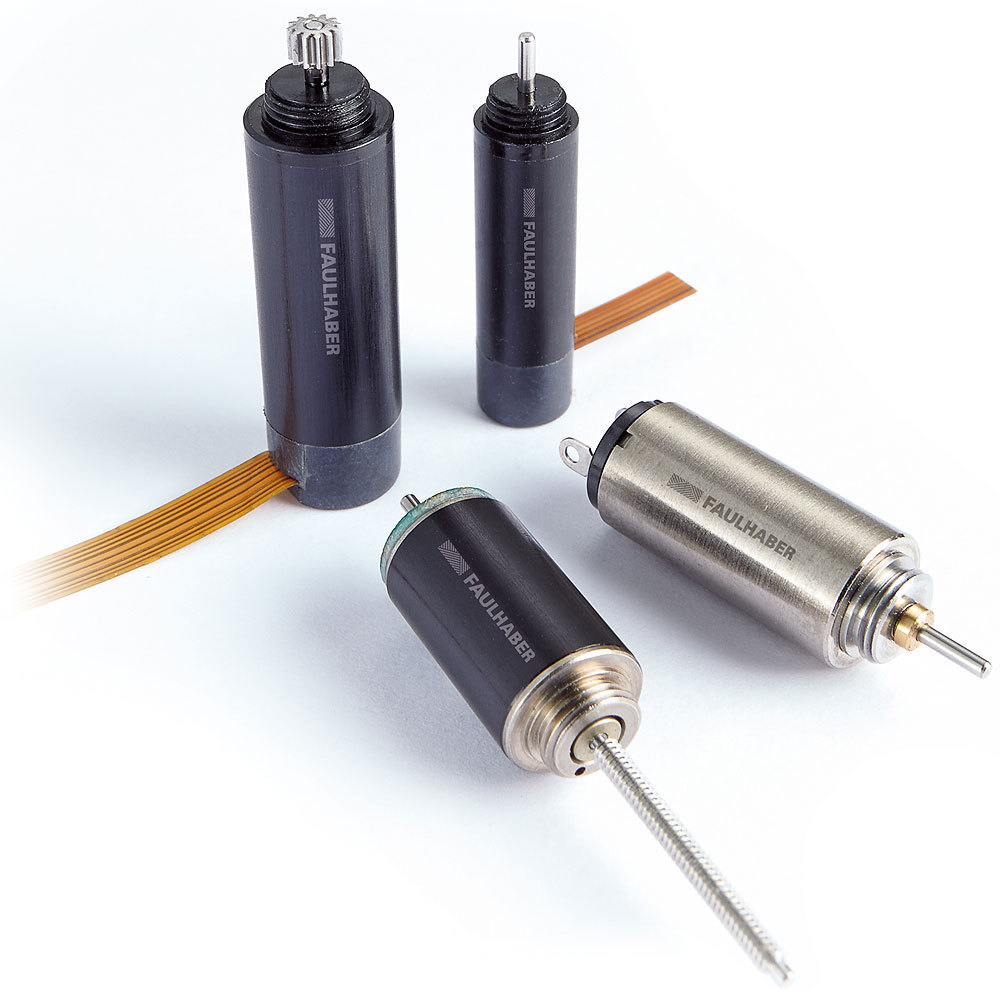
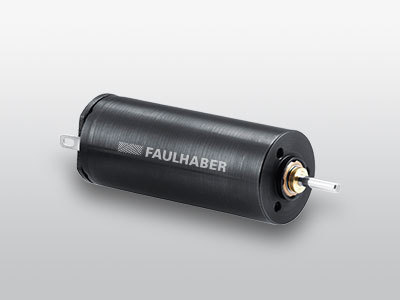
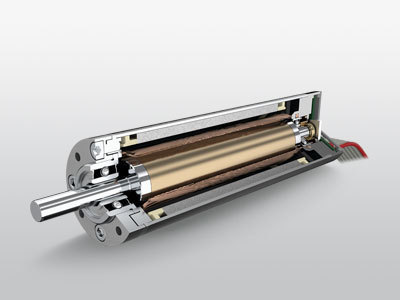
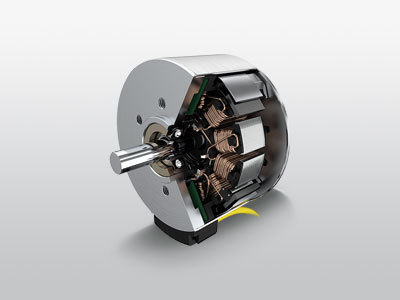
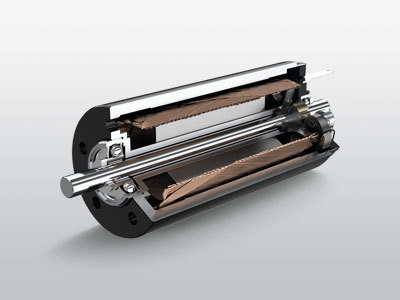
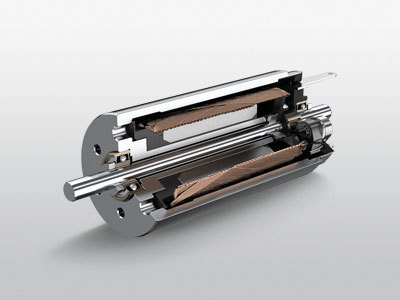
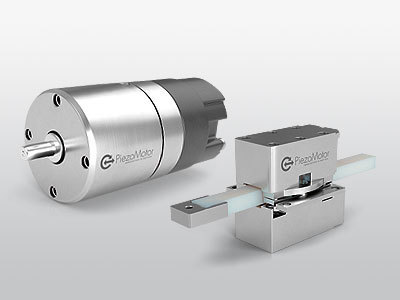
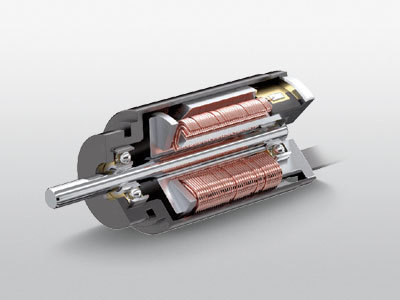
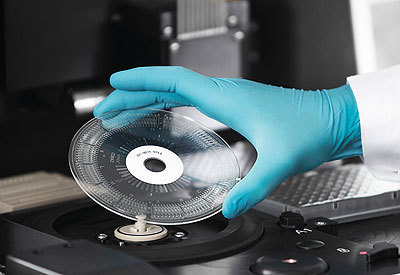
To perform an analysis, the device draws in about 60 m³ of air per hour and extracts the pollen on sample carriers. Pollen look rather shriveled due to the impact of weather and drying. A layer of gel on the sample carriers plumps them up again and makes them round. "This step alone requires a high degree of precision. An automatic analysis must be able to capture small differences in size or the interior structure," Dr. Haus points out. Pushers that are driven byFAULHABER DC-micromotorsof the1727… Cseries, then move the samples underneath a microscope between condenser and lens. A heating cartridge heats the gel slightly. Each sample is then scanned on three axes. "At 20 μm, pollen are tiny. They're about a quarter of the size of a human hair. The light microscope therefore sees an area of less than 0.5 by 0.5 mm in each photo. The depth of field is not that great because we need a high resolution," says the Microscopy Product Manager.
Intelligent image recognition
To identify the pollen, Hund uses the so-called stacking principle in which images are stacked with the help of software. This technique is also used by amateur astronomers, for example. This approach allows you to generate an overall image with an extended depth of field from several images of the image stack (each with a shallow depth of field). Then the individual pollen grains are identified by the software via a feature-based algorithm. The system is currently capable of identifying 38 types of pollen and other allergens, such as fungal spores. "Image recognition first has to be taught in, depending on local differences and weather conditions. That is why we keep thousands of images in the trunk. To be able to go outside, measure, and recognize automatically, you need as many examples and species as possible."
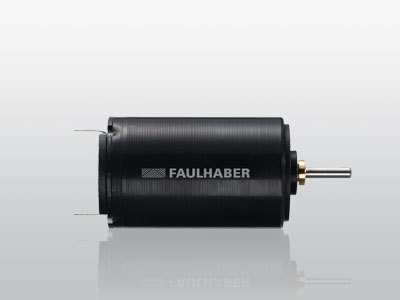
After analysis, the sample is transported into a magazine. This enables subsequent analysis and validation of the results, for example by scientists. In theory, this can take place months later. Analysis via the light microscope and the fact that the samples are retained make the BAA500 unique compared with other similar systems. AnotherFAULHABER DC-micromotorof the1727…Cseries takes care of the necessary movement and precision during archiving.
"Ambrosia looks a bit like a spiky ball, pine looks like Mickey Mouse. That should be easy to distinguish, but it gets very challenging when you want to clearly tell apart adjacent early bloomers," explains Dr. Haus. Another problem are so-called varia, i.e. pollen which are still unidentified. These pollen are compared to the database, provisionally categorized, and then an operator checks and assigns the pollen. "This allows us to add new species, but also make corrections if a species looks different, for example in the cold spring of this year."
The real-time monitoring also produces very interesting findings. "Previously, aerobiologists assumed that there is no pollen in the air in cold weather. But our measurements showed that we had pollen in cold January."
Powerful network
The Free State of Bavaria was so impressed with the system that it began setting up an electronic pollen information network (ePIN) back in 2019. The locations were selected on the basis of a study by the Center for Allergy and Environment (ZAUM) at the Technical University of Munich and the research center Helmholtz Zentrum München. Various climate parameters and the population density were taken into account to optimally distribute the eight measuring stations. In addition to Munich, devices from Hund are now located in Garmisch-Partenkirchen, Feucht, Viechtach, Marktheidenfeld, Altötting, Mindelheim, and Hof. "The Bavarian Ministry of Health invested two million euros into this the world's first electronic pollen information network. This is a good investment, because 50% of the two million allergy sufferers in Bavaria react to pollen," said Bavaria's Minister of Health Melanie Huml during the launch in 2019.
"The true power of these devices lies in networking," Dr. Haus believes, "you can make very precise predictions if you combine the data from the various pollen analysis stations and the weather data." There are a total of 20 devices in Berlin, Wetzlar, Leipzig and Wiesbaden in addition to the Bavarian ePIN locations. Choosing the right location is very important, as diesel soot or tire abrasion, for example, can impact the results. "It wouldn't make any sense to set it up in the middle of a rapeseed field where you only get rapeseed pollen. This is why we set up our measuring stations at a height of about 12 meters on the roofs of clinics or institutes."
The data can be retrieved in real-time around the clock online or via an app. Even medical practices or allergists like to use the service to optimally treat their patients. "Our device in Wetzlar is our test unit, and every time we want to try out a new function we have to shut it down. While carrying out such a test, we had a lot of people calling in asking for the data. It showed us that our analysis is very important to a great number of people. That is another reason why we useFAULHABER drives, because they are reliable, precise, and durable."